
You must have heard about the term Data organization. It refers to the way we arrange and structure information so that it is easy to find, understand, and use. Imagine your room with books scattered everywhere – it would be hard to find what you want, right? Similarly, in the digital world, data needs to be organized. This involves putting similar things together, like grouping books of the same genre. There are different methods for organizing data, such as using folders and categories. Think of folders as containers where you keep similar items together, and categories as labels that tell you what’s inside. Good data organization makes it simpler to manage and retrieve information, saving time and reducing confusion, just like keeping your books in order makes reading more enjoyable!
In this sector of organizing information, there are two important words: rows and columns. These words help us understand how information is stored and moved around in different places, like Excel spreadsheets and databases. Let’s take a closer look at what these words mean and how they are different from each other.
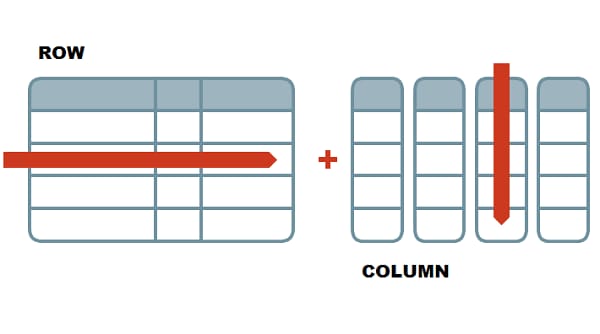
WHAT ARE ROWS?
In the world of information, think of a row as a horizontal line that holds a bunch of details together in a list. It’s like a special card that contains all the important information about something or someone. For example, in a list of employees, each row could be like a card for a specific person, showing things like their name, ID, and the department they work in. In the context of a table or a spreadsheet, a row is a horizontal line of cells. Each row usually represents a single record or data point.
WHAT ARE COLUMNS?
Now, let’s talk about columns. Imagine them as the up-and-down sections in our list of information. Each column is like a category showing a specific thing, such as names, ID numbers, or departments. In our employee list, these columns help us see different details about each person. So, while rows are like individual cards with all the info about one person, columns are like the different categories telling us more about everyone in the list. A column, on the other hand, is a vertical line of cells in a table or spreadsheet. Each column typically represents a specific category of data.
KEY DIFFERENCES BETWEEN ROWS AND COLUMNS
The key differences between rows and columns lie in their orientation, representation, and function in a table or grid.
1. Orientation:
– Rows: Horizontal lines in a table or grid.
– Columns: Vertical lines in a table or grid.
2. Representation:
– Rows: Represent a set of related values or information about an individual entry.
– Columns: Represent a specific attribute shared across multiple entries.
3. Example:
– Rows: In an employee database, each row might represent details about a specific employee.
– Columns: In the same employee database, columns could include attributes like name, ID, and department for all employees.
4. Function:
– Rows: Provide a unique record or entry in the dataset, encapsulating related information.
– Columns: Organize and display different types of information for the entries in the rows.
5. Analogy:
– Rows: Similar to an index card with specific details about one thing.
– Columns: Similar to categories or labels that provide different perspectives on the data.
In summary, rows are horizontal and represent individual entries with related information, while columns are vertical and organize specific attributes shared across multiple entries, offering different viewpoints on the data.
IMPORTANCE IN DATA ANALYSIS
Rows and columns are super important when we look at data. Think of them like the building blocks of information. In data analysis, especially when we make graphs or charts to understand information better, how we put things in rows and columns really matters. It’s like setting up the stage for a play – if it’s well-organized, the story is clear. In the same way, decision-makers depend on neatly arranged rows and columns to make smart choices based on the information they see. So, the way we arrange data in rows and columns is a big deal because it helps us show and understand information in a way that makes sense.
USAGE IN PROGRAMMING
In computer programming, rows and columns are like the building blocks for handling data. You can think of them as the basic tools that help organize information in a way that computers can understand. In programming languages, there are things called arrays and matrices that use rows and columns to work with data smartly. When programmers write sets of instructions, known as algorithms, they often need to go through rows and columns to make things happen. So, in the world of coding, rows, and columns are super important because they help programmers efficiently organize and manipulate data to create all sorts of cool stuff.
RELATIONSHIP BETWEEN THEM
The connection between rows and columns is like a team effort, especially in databases. Rows and columns work together and depend on each other. If something changes in one, it can also affect the other, and this might mess up how accurate and trustworthy the information is. So, it’s really important to know and handle this teamwork well to keep databases in good shape and make sure the information is correct and dependable. In the end, knowing the difference between rows and columns is really important. It’s like understanding the ABCs of organizing information, whether you’re working with spreadsheets, databases, graphs, or matrices. Rows are like cards, each holding details about one thing, while columns are like categories that show different aspects, such as names or numbers. The teamwork between rows and columns is like the building blocks for how we set up and understand information. This teamwork helps us manage and analyze data efficiently in lots of different areas.

Leave a Reply