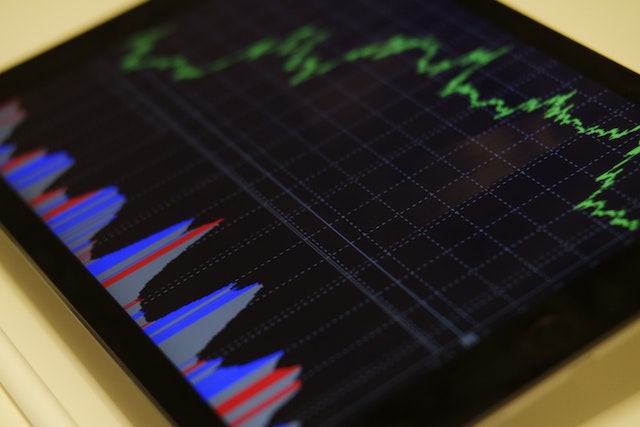
Traders often use volume profile to help them identify potential support and resistance levels. It is a charting technique that shows how much volume was traded at each price level throughout a trading session. It is often combined with other indicators to provide additional insight into market activity. Volume profile may also be helpful for identifying trends and predicting future direction.

The concept of volume profile is based on the idea that markets have memory and prices tend to return to previous price levels that attract large amounts of volume. When a large amount of volume is traded at one price level, it acts as a magnet and may draw in other traders to enter the market. This could create a momentum shift at that particular price level and potentially change the direction of the market.
Volume profile shows the number of shares or units that were traded at each price level for a trading session. It is a useful tool for analyzing the market and helping traders to make informed decisions about their trades. Volume profile is available in several different settings and can be customized to suit each trader’s unique needs.
For example, traders can choose to display either total volume or buy and sell volume to view different aspects of trading activity. They can also customize the color settings to highlight key areas of the chart. In addition, they can choose to include or exclude the POC and Value Area (by default, 70% of the total volume is included). This allows them to tailor the indicator to their specific needs and to monitor key levels such as the POC, VAH, HVNs, and LVNs.
The indicator displays a histogram with each bar representing the amount of volume that was traded at a specific price level during a time period. The higher the bar, the more volume was traded at that price level. Traders can then interpret the histogram and look for patterns or indications of a trade opportunity.
In the video below, trading coach Rick Ducat explains how to use volume profile and provides examples of its key features. He explains the Point of Control, the most popular place to enter trades, as well as the importance of identifying high and low volume nodes and the value area. He also demonstrates how to spot volume spikes and how to spot a fade out, as well as showing the power of using a previous day’s volume profile. Want to learn more about how to use volume profile as part of your trading strategy? Check out our comprehensive course, Trading with Price Action and Volume Profile, on Udemy. It covers advanced price action and volume profile techniques, and will help you build a robust day trading or swing trading strategy. It’s completely free to try, so sign up now!


Leave a Reply